How to Design a Graphical Abstract
A practical, answer-first guide to planning a clear graphical abstract for journal submission and research communication.

Scientific illustration and research communication studio
Published 22 June 2026
Last updated 27 July 2026 · 5 min read
What is a graphical abstract?
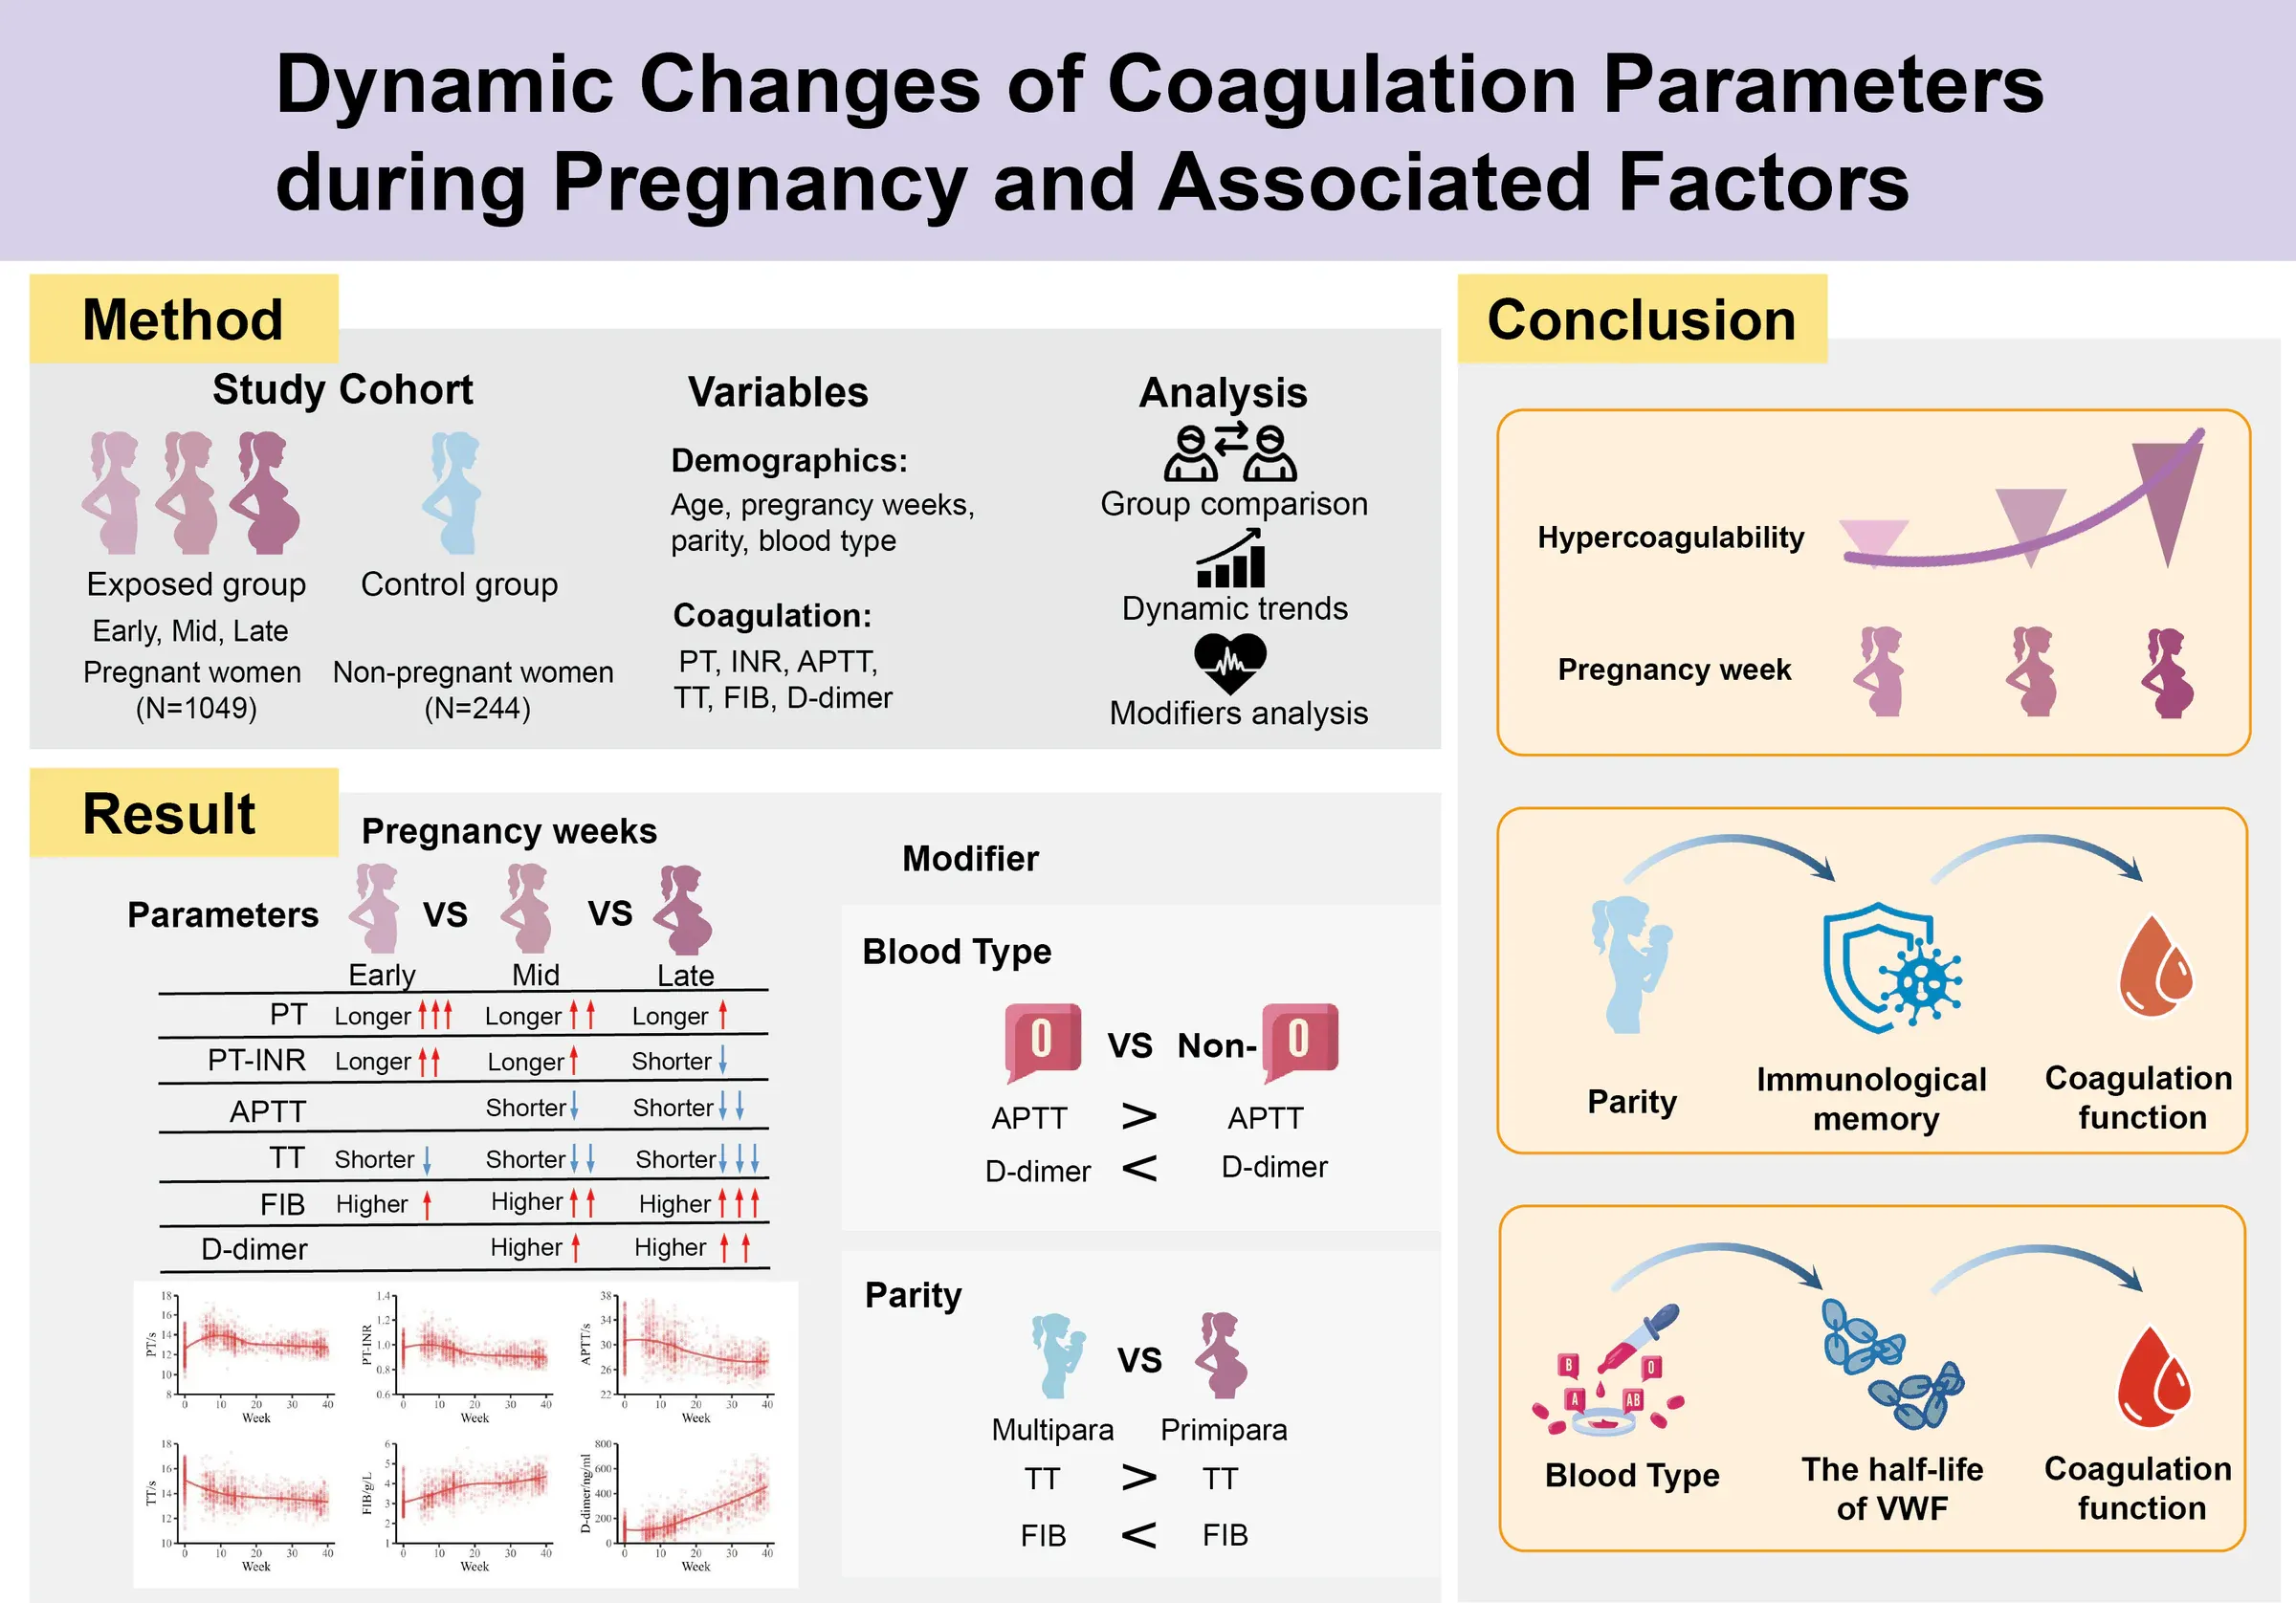
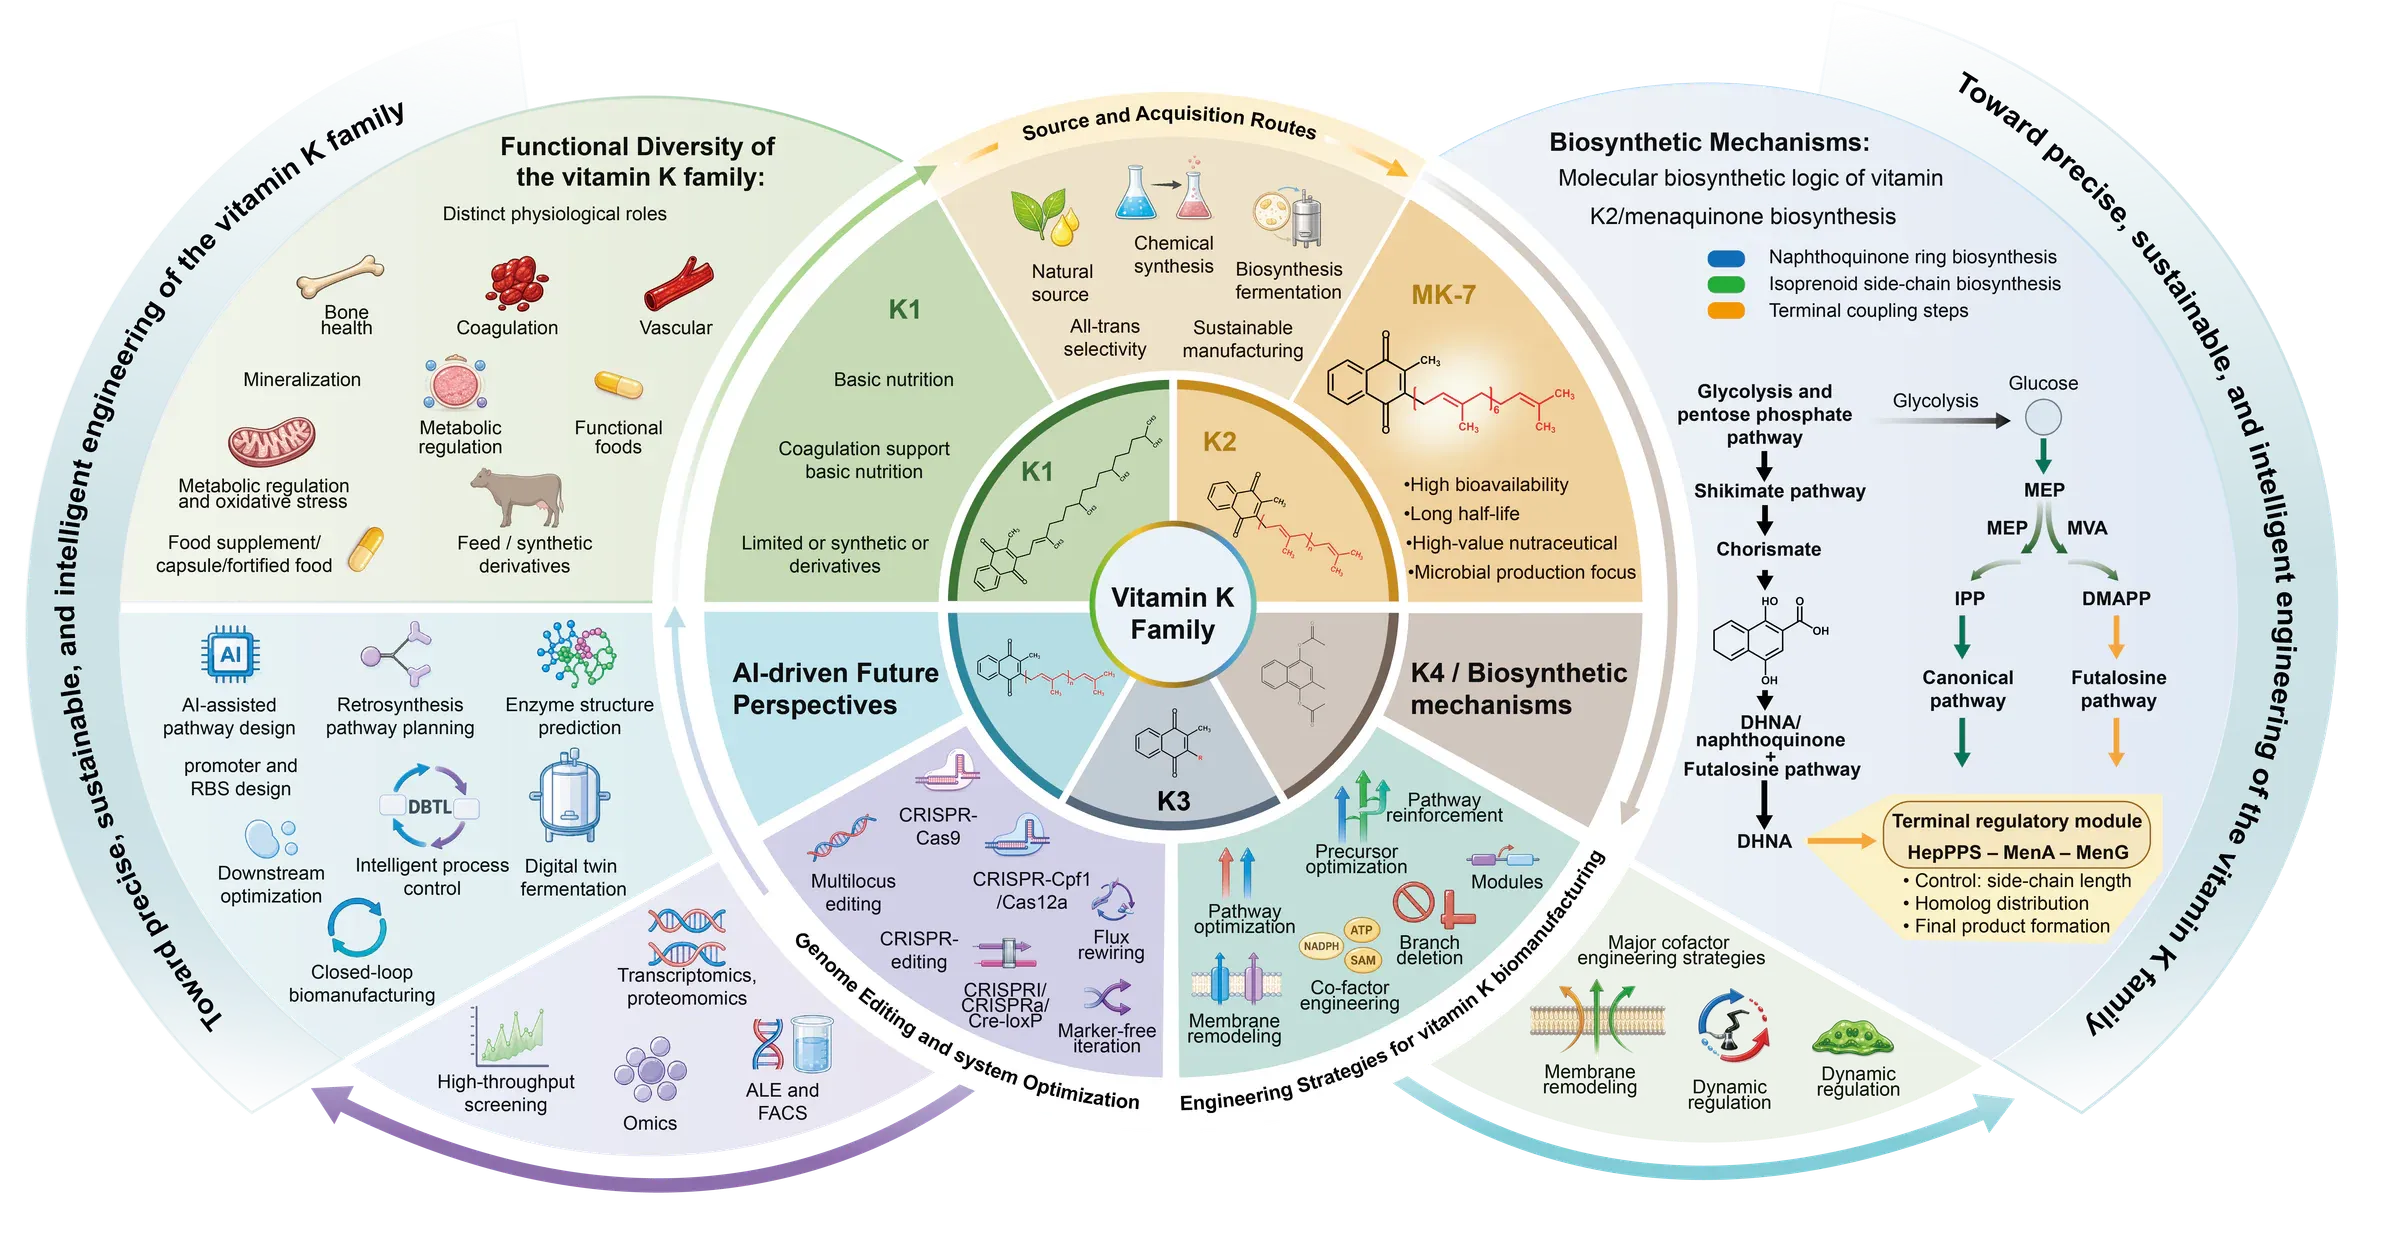
A graphical abstract is a single visual that communicates the central message of a research paper. It is designed for fast orientation: a reader should be able to identify the research context, the essential process or comparison, and the main outcome without reading a miniature version of the manuscript.
Unlike a conventional figure, a graphical abstract does not need to display every control, parameter, or secondary result. Its job is to reveal the paper’s overall logic. A figure may support one claim in the Results section; a graphical abstract presents the relationship between the question, approach, and takeaway.
That distinction matters because graphical abstracts are often viewed at small sizes in journal contents pages, search listings, presentations, and social posts. A design that works only when enlarged is not doing its job.
What should you decide before designing?
Decide the one message a reader should remember before selecting icons, colours, or software. Write that message as a plain-language sentence, then identify the minimum visual evidence needed to support it.
A useful planning brief contains four parts:
- Context: What system, material, disease, or research problem is being studied?
- Action: What intervention, mechanism, method, or comparison drives the story?
- Outcome: What changed, and in which direction?
- Audience: Which concepts can the intended reader already understand without explanation?
This first pass should be verbal, not decorative. If the message cannot be expressed clearly in one or two sentences, adding more visual elements will usually make the problem harder to solve.
What are Elsevier’s requirements?
Elsevier’s general guidance provides a useful baseline, but the target journal’s Guide for Authors remains the final authority. As of July 2026, Elsevier asks for an original image submitted as a separate file, with a clear start and end and a reading direction that is usually left to right or top to bottom.
The publisher’s graphical abstract guidance specifies a minimum canvas of 1328 × 531 pixels at 300 dpi, or a larger image at the same ratio. Preferred file types include TIFF, EPS, PDF, and Microsoft Office formats. It also advises authors to avoid unnecessary white space and not to add a redundant “Graphical abstract” heading inside the artwork.
Treat these as export constraints rather than a design template. Before final delivery:
- open the exact journal instructions and confirm whether a graphical abstract is required or optional;
- verify dimensions, file type, colour mode, naming convention, and upload location;
- check whether third-party assets, stock imagery, or generative tools are permitted;
- test all labels after scaling the artwork to its expected online display size;
- prepare accurate alternative text when the submission workflow requests it.
Elsevier’s current author guide to image alt text also makes clear that authors must review image descriptions during proofing. Alt text should communicate the meaning of the visual, not merely list colours and shapes.
How should information flow through the visual?
The reading path should make the research question, intervention, and main result understandable without searching the page. Choose a structure that matches the scientific relationship instead of forcing every project into the same row of icons.
| Structure | Best for | Watch for |
|---|---|---|
| Linear | Sequential methods or mechanisms | Too many steps |
| Comparison | Control versus intervention | Unequal visual weight |
| Central model | One system with linked findings | Crowded annotations |
For a linear mechanism, use alignment and directional arrows to establish sequence. For a treatment comparison, give the control and intervention equal starting weight so that the outcome, rather than panel size, communicates the difference. For a central model, keep the focal system dominant and group supporting evidence by proximity.
Visual hierarchy should do more work than labels. Size, position, contrast, and spacing can indicate what to read first. Colour should reinforce existing structure, not become the only way to decode it. When colour carries meaning, add labels, symbols, or patterns so the message remains available to readers with colour-vision differences.
The W3C contrast guidance applies to text embedded in images as well as ordinary page text. This is especially relevant when small labels sit over microscopy, tissue, or rendered backgrounds.
BioRender or hire a professional?
BioRender is efficient for standard diagram-led communication, while bespoke support is valuable when the scientific story or intended use needs custom problem solving. The choice is less about which tool is “best” and more about the level of interpretation, differentiation, and production control required.
| Route | Works well when | Consider |
|---|---|---|
| DIY presentation software | The story is simple and the team has design time | Consistency, export quality, and accessibility checks |
| BioRender or an icon library | Standard biological objects can explain the mechanism | Licence terms, visual similarity, and limited custom rendering |
| Bespoke scientific design | The mechanism is novel or the visual must serve several audiences | Briefing time, scientific review, scope, and usage rights |
Use a self-service tool when the team already knows the message and needs a clear, conventional diagram. Bring in professional support when the project requires original 2D or 3D assets, complex spatial relationships, unusually dense evidence, multiple outputs, or a visual identity that should not look interchangeable with template-based work.
What should you check before submission?
Check scientific accuracy, journal specifications, legibility, permissions, accessibility, and export quality before submission. A reliable review sequence is:
- Message check: Can a reader state the main finding after a brief look?
- Science check: Are structures, scales, directions, labels, and causal relationships accurate?
- Hierarchy check: Is there one obvious entry point and an unambiguous reading path?
- Reduction check: Does every element help explain the takeaway?
- Accessibility check: Is the text readable, and is meaning available without colour alone?
- Specification check: Does the file meet the target journal’s current instructions?
- Rights check: Are all assets cleared for the intended publication and promotional uses?
- Export check: Does the delivered file remain sharp and complete when opened outside the design application?
The final artwork should work as a compact explanation, not as proof that every part of the paper can fit on one canvas. When the story is well edited, the visual becomes easier to understand, easier to review, and easier to reuse across the research communication journey.