Graphical Abstract Template Guide (2026)
Build a graphical abstract template in PowerPoint with the right dimensions, hierarchy, typography, colour system, and export settings.

Scientific illustration and research communication studio
Published 27 July 2026
Last updated 27 July 2026 · 5 min read
What should a graphical abstract template actually do?
A graphical abstract template should reduce setup work while preserving the freedom to represent different scientific stories. It should define technical and visual rules, not supply generic scientific claims.
A useful template contains:
- the final canvas dimensions;
- safe margins and alignment guides;
- a small type hierarchy;
- an accessible colour palette;
- consistent arrow and line styles;
- optional structures for workflows, comparisons, and central mechanisms;
- export notes and a pre-submission checklist.
It should not force every study into three equal boxes or include decorative molecules that have no relationship to the manuscript.
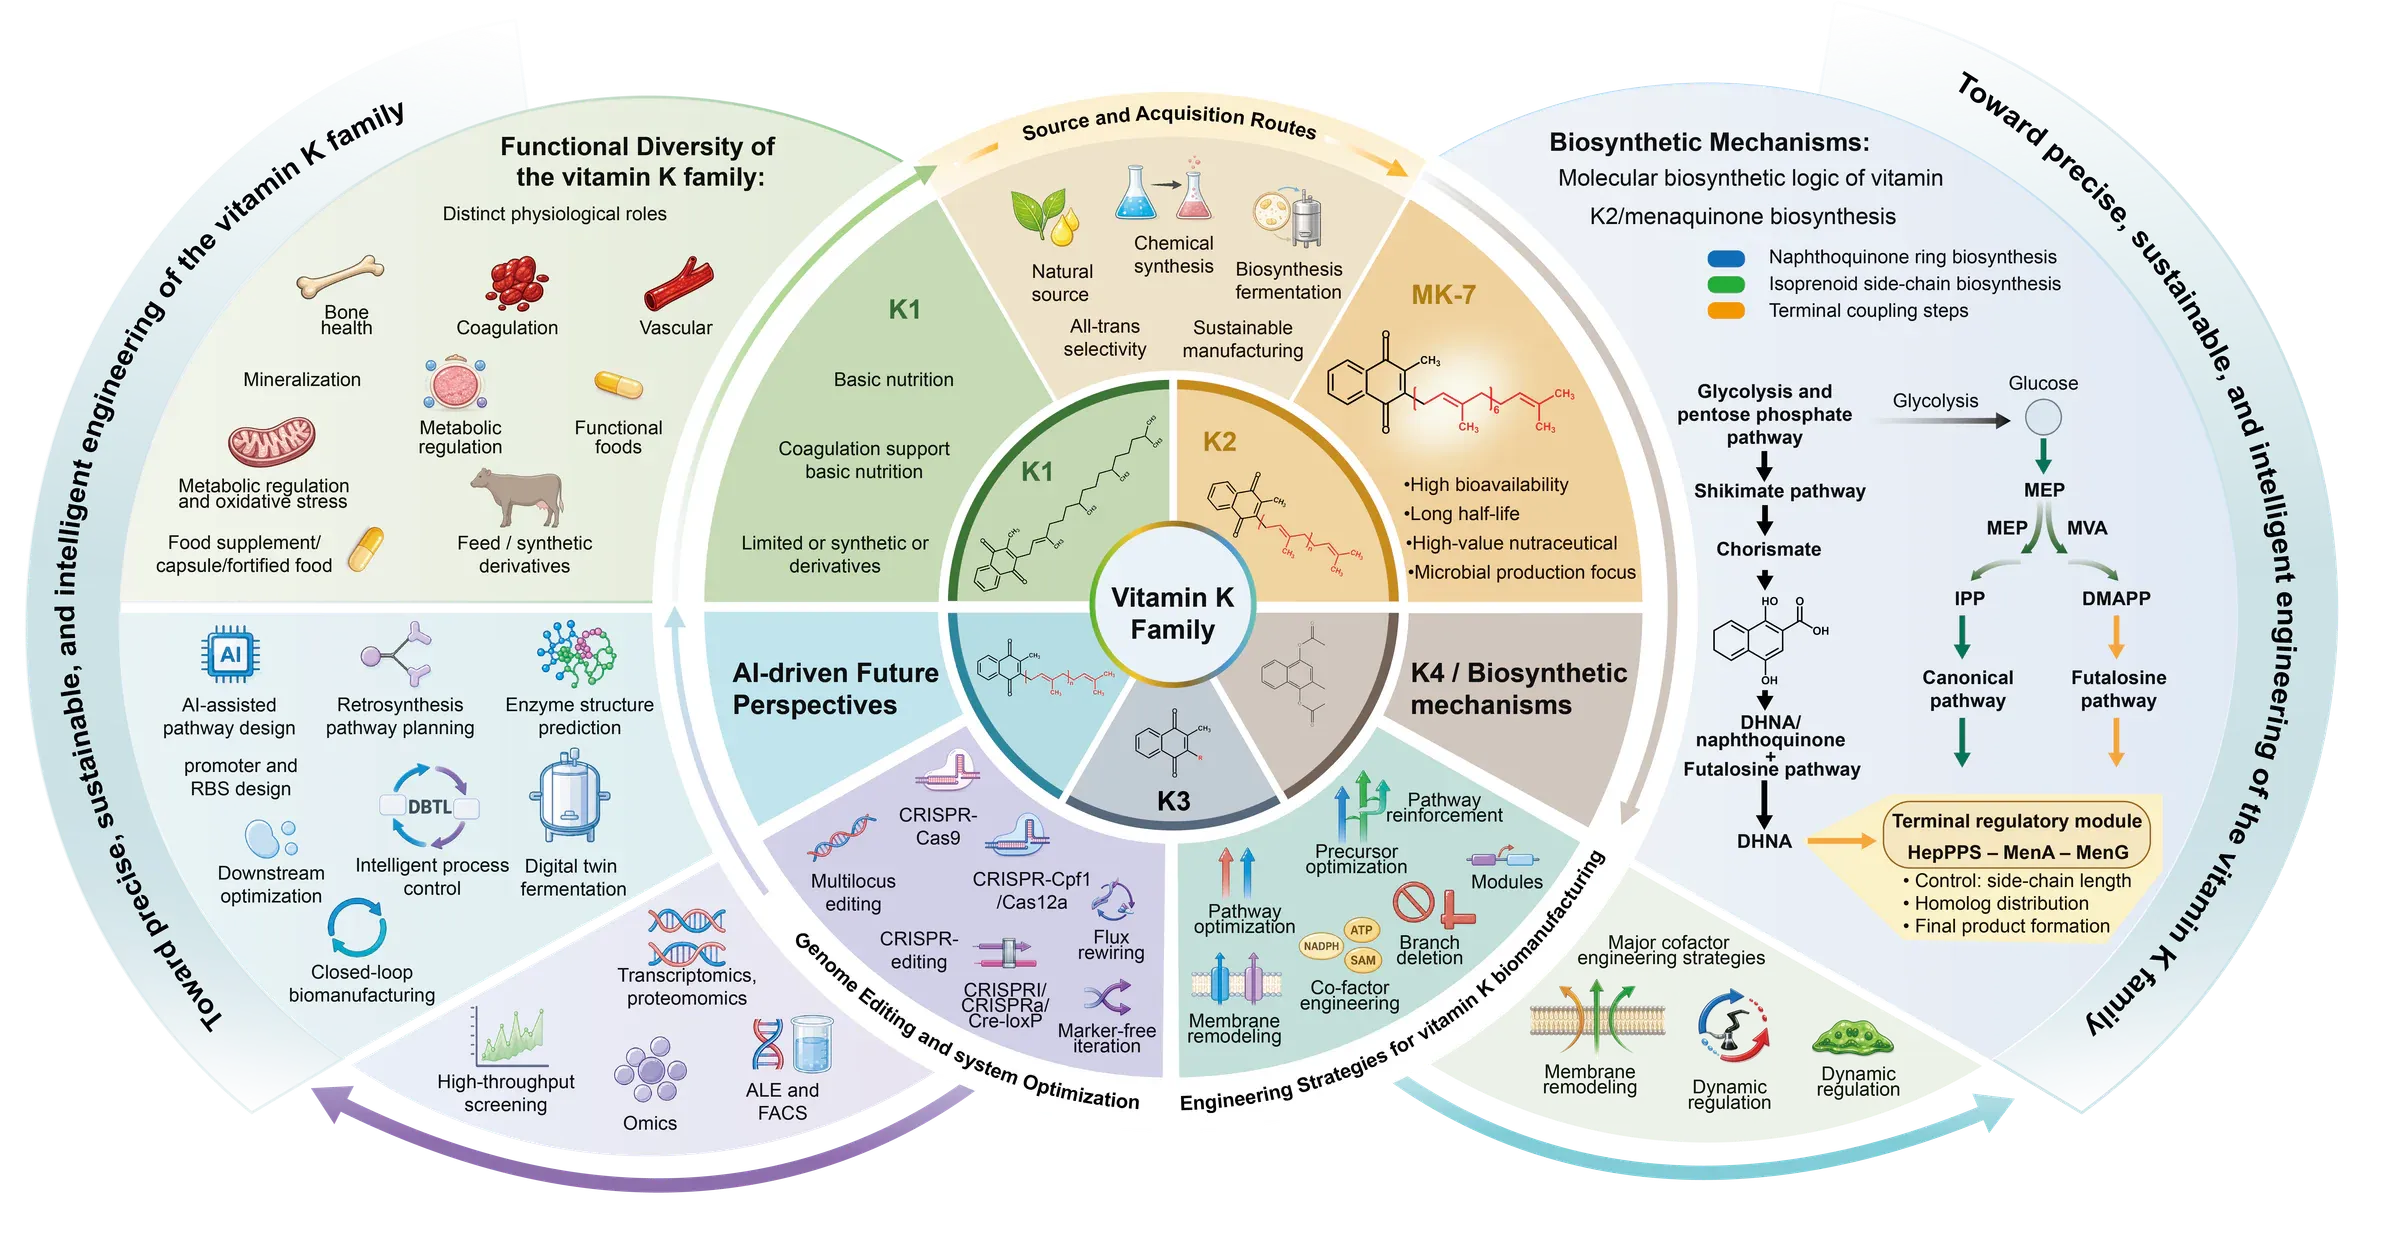
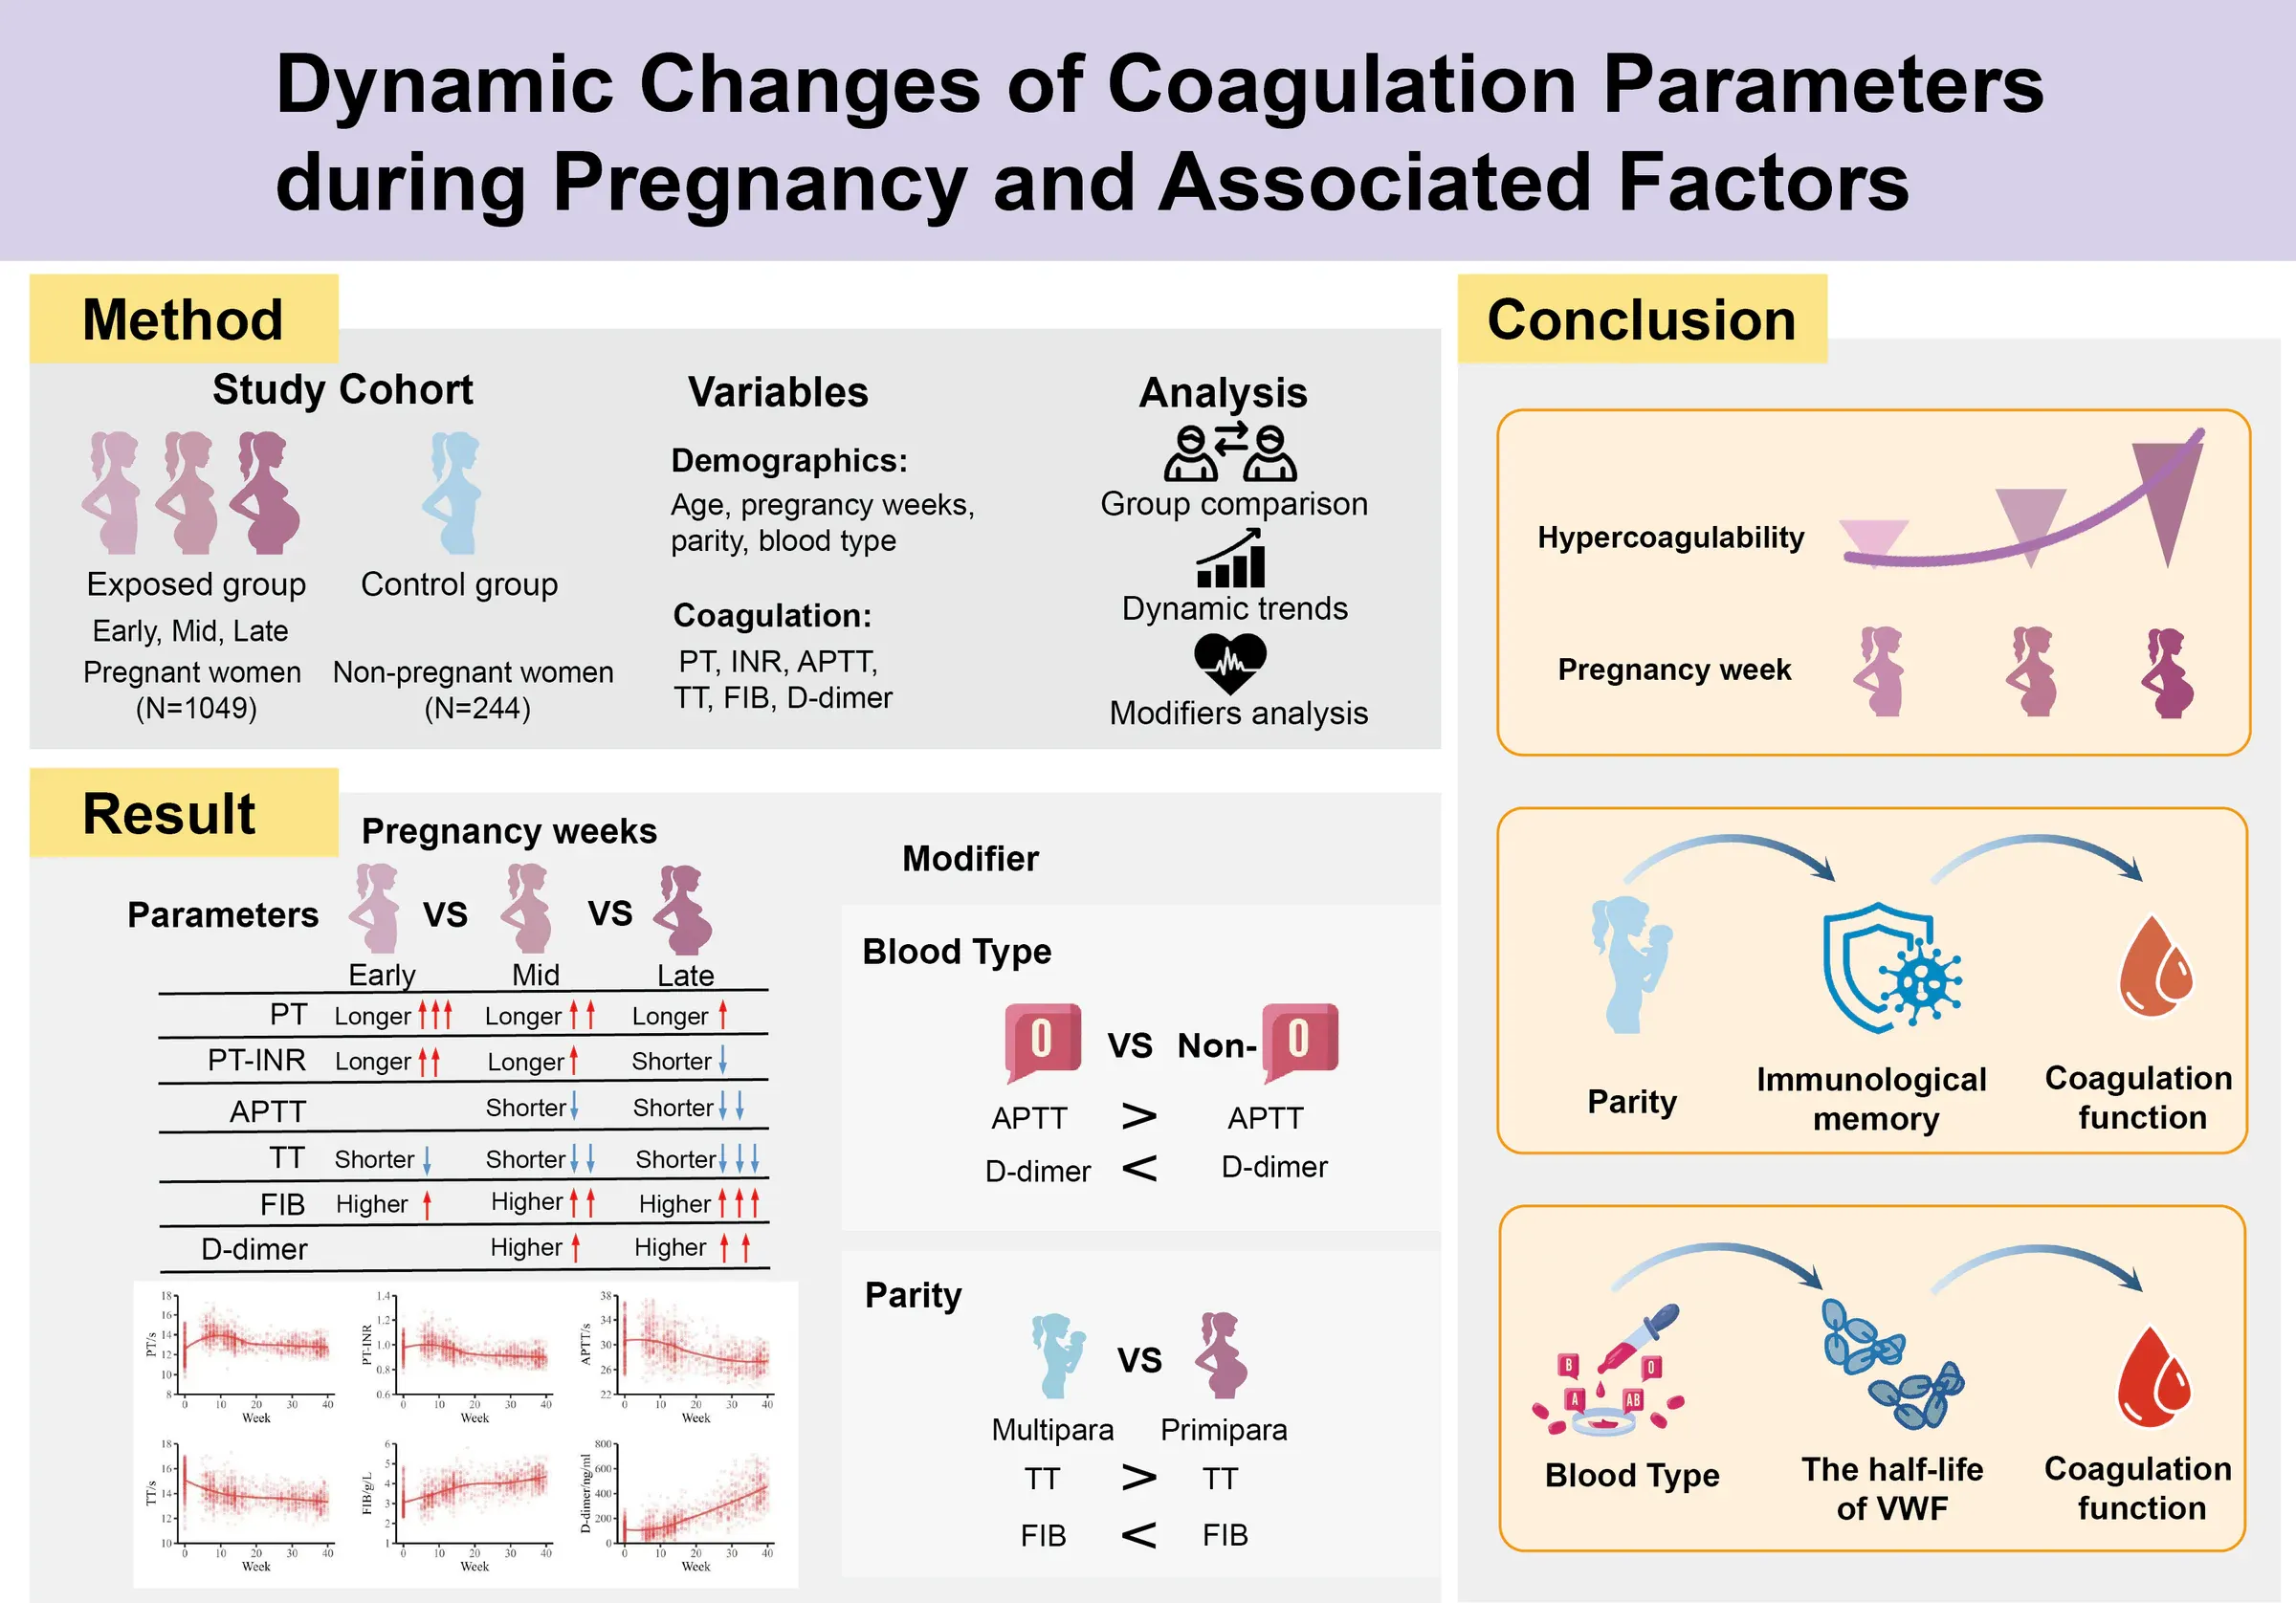
Elsevier’s graphical abstract guidance includes examples and a basic template, while also instructing authors to check the target journal’s Guide for Authors. Treat publisher templates as minimum technical guidance rather than a finished communication solution.
What dimensions should you set first?
Set the document to the target journal’s required dimensions before adding content. Changing aspect ratio late can break text wrapping, spacing, line weight, and the relationship between objects.
Elsevier gives a common baseline of at least 1328 x 531 pixels at 300 dpi, designed to remain legible in an approximately 500 x 200 pixel display. Other publishers and individual journals may use square, portrait, or different landscape formats.
Create a short specification record before design begins:
| Specification | Value to confirm |
|---|---|
| Width and height | Exact journal requirement |
| Resolution | Required dpi or pixel dimensions |
| File type | TIFF, EPS, PDF, Office, or journal-specific format |
| Colour mode | RGB or CMYK as instructed |
| Maximum file size | Submission system limit |
| Text restrictions | Labels, title, branding, abbreviations |
Our Elsevier graphical abstract requirements guide covers its current baseline in more detail.
How do you set up a template in PowerPoint?
Create one custom-size slide, add guides, and build reusable master elements before placing scientific content. Microsoft’s PowerPoint slide-size guidance explains how to choose standard, widescreen, or custom dimensions and notes that one size applies to the entire presentation.
A practical setup sequence is:
- Open a blank presentation and remove default placeholders.
- Set a custom slide size that matches the required aspect ratio.
- Add outer safe margins and one horizontal and vertical centre guide.
- Add optional column guides for common structures.
- Define title, label, annotation, and caption text styles.
- Create consistent arrow, connector, boundary, and panel-label styles.
- Add an off-canvas checklist with export requirements.
PowerPoint’s grid and guide controls can help maintain alignment and spacing. Guides do not appear in the exported image.
Which template structure should you use?
Include two or three alternative layouts rather than one universal arrangement. The structure should follow the research relationship.
| Structure | Use when | Template guides |
|---|---|---|
| Linear workflow | The study has a clear sequence | Three to five stages on one axis |
| Central mechanism | One interaction explains the outcome | Central object with input and outcome zones |
| Comparison | Conditions must be evaluated together | Matched left and right regions |
| Evidence map | Several findings support one conclusion | Primary claim plus ranked evidence modules |
The graphical abstract examples guide shows when each pattern works and what commonly goes wrong.
What typography belongs in the template?
Typography should remain readable at the final display size and should create a predictable hierarchy. Use one sans-serif family with two or three weights unless the journal specifies otherwise.
Define:
- one primary label size;
- one smaller annotation size used sparingly;
- bold emphasis for short keywords rather than full paragraphs;
- consistent mathematical notation and symbols;
- minimum spacing between text and surrounding objects.
Avoid long uppercase headings, condensed body type, outlined letters, and text over detailed images. Test the template by exporting a sample and viewing it at the expected online size, not only at 100% in PowerPoint.
How should colour be built into the template?
Colour should encode scientific meaning and hierarchy. Create a quiet neutral base, one main accent, and a small categorical or sequential data palette.
The W3C contrast guidance provides a useful screen-based reference for label contrast. Scientific images also need redundant cues because colour alone may not distinguish conditions for every reader.
Include:
- dark text and high-contrast labels;
- consistent colours for the same condition across the image;
- line style or shape differences alongside colour;
- a grayscale review swatch;
- no automatic red-green comparison.
Do not lock the template to fashionable colours that conflict with microscopy, heatmaps, or discipline-specific conventions.
What belongs in the template library?
A compact library should contain functional elements that are repeatedly useful:
- arrow types with documented meanings;
- zoom indicators and callout frames;
- comparison dividers;
- process stages;
- simple organ, cell, material, and device placeholders;
- legend styles;
- scale bars and annotation markers;
- source and licensing notes.
Replace placeholders with accurate original or licensed assets. Generic cell icons are not suitable when morphology, anatomy, material structure, or experimental setup affects interpretation.
Browse the Resources library for reusable starting points, but verify every file against the target journal before submission.
How do you export from PowerPoint without losing quality?
Export quality must be checked outside PowerPoint. A slide that looks sharp on screen can become soft after raster export or submission-system processing.
Use this process:
- Save the editable source file.
- Export a PDF when the journal accepts vector-compatible output.
- Export TIFF or PNG at the required pixel dimensions when raster output is required.
- Open the exported file and confirm its width, height, and resolution.
- Zoom into labels, thin lines, transparency, and image edges.
- Compare the file against the journal’s maximum size and colour requirements.
Do not rely on screenshots. Screenshots inherit display resolution and can introduce cropping or scaling errors.
When is a template not enough?
A template is not enough when the study depends on complex anatomy, molecular structure, a novel device, multiscale relationships, or a mechanism that cannot be explained with generic objects.
Custom work is also useful when:
- several manuscript figures must become one coherent visual;
- the graphical abstract will be adapted into slides, posters, and web content;
- visual claims need detailed scientific review;
- licensing prevents reuse of existing figures;
- a premium journal presentation requires a distinctive composition.
Start with the step-by-step graphical abstract guide to prepare the scientific brief. For a custom template or complete publication visual, contact Lattice Visual with the paper, target journal, and required formats.