Graphical Abstract Examples: 7 Clear Layouts
Explore seven graphical abstract layout examples and learn when to use each structure for mechanisms, workflows, comparisons, and research outcomes.

Scientific illustration and research communication studio
Published 27 July 2026
Last updated 28 July 2026 · 6 min read
What makes a graphical abstract example effective?
An effective graphical abstract example makes the paper’s central relationship understandable before the reader studies the caption. It is selective, directional, and designed for the small display sizes used in journal listings and search results.
Elsevier’s graphical abstract guidance describes the format as a concise, pictorial summary intended to appeal to an interdisciplinary audience. Its examples vary in visual style, but they share a common discipline: each one reduces a full article to a limited visual argument.
When reviewing an example, look beyond colour and rendering style. Ask:
- Where does the eye enter the composition?
- What is the main scientific object or comparison?
- Which arrow, boundary, or spatial relationship carries the argument?
- What detail has been deliberately removed?
- Can the conclusion be stated after a ten-second scan?
Our selected graphical abstract cases show how the same principles can work across clinical evidence, biomaterials, treatment mechanisms, and experimental workflows.
Which seven graphical abstract layouts work well?
Seven reusable layout patterns cover most journal graphical abstract needs. They are not templates in the sense of fixed artwork; they are information structures that can be adapted to a paper’s logic.
1. Linear workflow
A linear workflow moves from input to method to outcome. It works well for synthesis, fabrication, experimental protocols, treatment sequences, and computational pipelines.
Use three to five stages with one consistent direction. Keep secondary conditions below the main path so the reader does not confuse them with core steps.
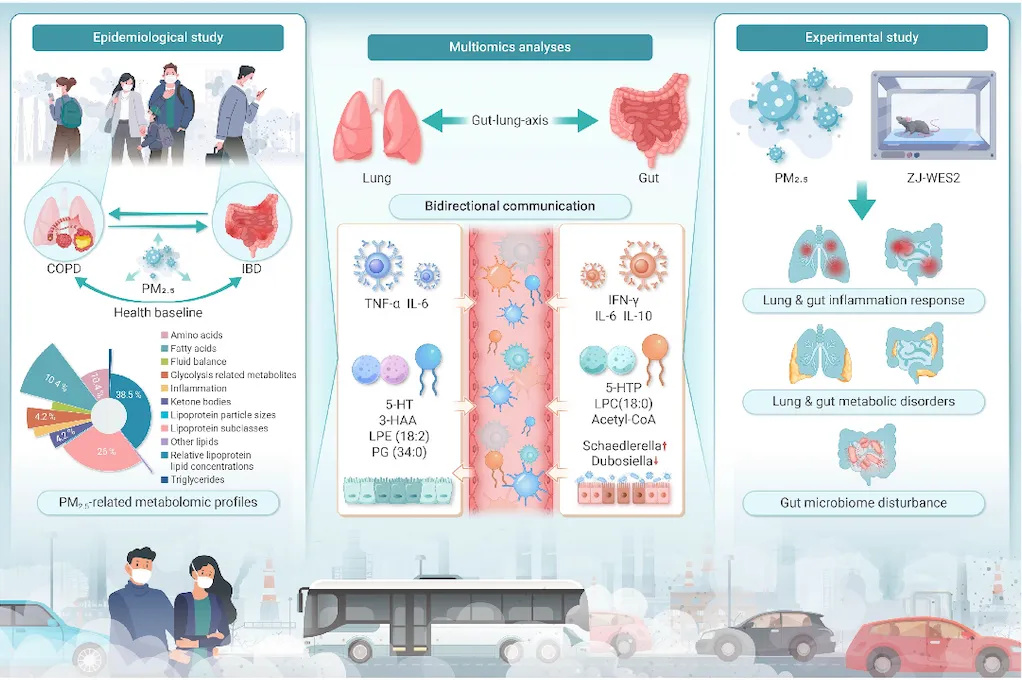
A three-part evidence workflow: population observations establish the question, multiomics analysis explains the lung-gut relationship, and experimental models test the proposed response.
2. Central mechanism
A central mechanism places the principal cell, organ, material, device, or molecular interaction at the centre. Inputs approach from one side and consequences leave from another.
This structure suits papers where the contribution is a causal explanation. It is less effective when the study is mainly comparative or when several independent mechanisms compete for attention.
3. Before and after
A before-and-after layout separates baseline and changed states. It is useful for treatment response, material modification, disease progression, environmental intervention, and design optimisation.
Hold viewpoint and scale constant whenever possible. If the two halves change camera angle, colour meaning, and object scale at the same time, readers may interpret visual differences that are not supported by the study.
4. Side-by-side comparison
A side-by-side comparison evaluates two or more conditions using aligned evidence. It works for control versus treatment, method A versus method B, healthy versus diseased, and conventional versus proposed systems.
Use the same visual grammar for both sides. Matching scales, labels, and object positions make the scientific difference easier to see.
5. Multiscale zoom
A multiscale zoom travels from an organism or device into tissue, cell, molecular, or material detail. It is valuable when the paper connects effects across levels.
Limit the number of zooms and make each transition explicit. Decorative magnification circles without a clear source region can weaken spatial accuracy.
6. Evidence map
An evidence map organises several findings around one research question. It suits reviews, clinical evidence summaries, multi-cohort studies, and papers whose contribution comes from combining several data types.
The hierarchy must distinguish primary evidence from modifiers, methods, and context. Avoid giving every box the same size and colour.
7. Cyclical pathway
A cyclical pathway shows feedback, regeneration, repeating biological processes, or circular material systems. Use it only when the process genuinely returns to an earlier state.
Do not force a linear study into a circle for visual interest. A circular arrow implies recurrence, so it must match the science.
| Layout | Best for | Common risk |
|---|---|---|
| Linear workflow | Processes and protocols | Too many procedural steps |
| Central mechanism | Causal and pathway studies | Crowded centre |
| Before and after | Intervention and change | Inconsistent viewpoints |
| Side-by-side | Controlled comparisons | Unequal visual treatment |
| Multiscale zoom | Cross-scale biology and materials | Unclear spatial origin |
| Evidence map | Reviews and multi-source findings | Weak hierarchy |
| Cyclical pathway | Feedback and repeated systems | False implication of recurrence |
How do you choose the right layout?
Choose the layout by writing the paper’s main relationship as a short sentence. The verbs in that sentence often reveal the structure.
- “A becomes B through C” suggests a linear workflow.
- “A activates B, which changes C” suggests a central mechanism.
- “Treatment changes the system from A to B” suggests before and after.
- “Method A outperforms method B” suggests side-by-side comparison.
- “A tissue-level effect arises from a cellular mechanism” suggests multiscale zoom.
Do not begin with the number of figures in the manuscript. Begin with the claim the graphical abstract must help the reader understand.
How much detail should an example include?
Include enough detail to make relationships scientifically defensible, but remove detail that does not change interpretation. Labels, objects, and data should earn their place by answering a reader question.
Essential details may include:
- the studied system or population;
- the intervention, condition, or comparison;
- the main mechanism or analytical step;
- the principal result;
- units, scale, or direction where interpretation depends on them.
Details that often move to the caption include full reagent lists, minor experimental branches, secondary endpoints, exhaustive statistical values, and long definitions.
The graphical abstract design guide explains how to move from a manuscript to this reduced content architecture.
How should you use published examples without copying?
Use published examples to identify structural decisions, not to reproduce their artwork, visual identity, or distinctive composition. Copyright and scientific accuracy both require an original result.
A responsible reference process is:
- collect examples from the target journal and related disciplines;
- label the information structure used by each example;
- note what creates the reading order;
- sketch your own study using simple boxes and arrows;
- develop original objects, labels, and composition from the sketch;
- retain source records for any licensed or adapted material.
The target journal’s own examples are especially useful because they reveal expected detail, dimensions, and visual density. Always confirm those observations against the current Guide for Authors.
What mistakes make graphical abstract examples difficult to read?
The most common problems are not artistic. They are information-design failures.
- No clear start: the reader cannot find the entry point.
- Equal emphasis: every object, label, and panel appears equally important.
- Decorative arrows: arrows show movement without defining what moves or changes.
- Tiny text: labels work in the design file but fail at thumbnail size.
- Mixed perspectives: objects change scale or viewpoint without explanation.
- Unsupported certainty: visual cause-and-effect is stronger than the evidence.
- Copied paper figures: axes, legends, and panel labels remain too dense for the new format.
Review at the final journal dimensions, then review again at the approximate size used in an online contents list.
How do you evaluate a final graphical abstract?
Evaluate comprehension, scientific fidelity, legibility, and originality in separate passes. A visually polished image can still fail if it changes the meaning of the paper.
Use this final test:
- Ask a colleague to state the main message after ten seconds.
- Reduce the image to thumbnail size and inspect every essential label.
- Follow every arrow and verify what relationship it encodes.
- Compare each claim with the manuscript and source data.
- Check colour in grayscale and with a colour-vision simulator.
- Confirm dimensions, resolution, file type, and submission rules.
For a reusable starting structure, read the graphical abstract template guide. For journal-specific technical requirements, use the Elsevier graphical abstract checklist.
When the study needs a custom visual system rather than a pre-set layout, start a graphical abstract project with the manuscript, target journal, and deadline.